Difference between revisions of "Evaluator report"
From TQAuditor Wiki
| (10 intermediate revisions by 3 users not shown) | |||
| Line 1: | Line 1: | ||
| − | ''Evaluator report page: [https://cloud.tqauditor.com/report/evaluator | + | ''Evaluator report page: [https://cloud.tqauditor.com/report/evaluator cloud.tqauditor.com/report/evaluator]'' |
---- | ---- | ||
| − | To view the | + | To view the report on a particular evaluator, go to "Reports" → "Evaluator report": |
| − | [[ | + | [[File:Evaluatofr report.png|border|200px]] |
| + | First, you should choose the evaluator. | ||
| − | + | You can also use the filters: | |
| − | [[ | + | [[File:1 evaluaor.png|border|200px]] |
| − | + | Click "Apply" to generate the report by specified criteria. | |
| − | + | The list of charts and tables in the translator report: | |
* Score dynamics | * Score dynamics | ||
| Line 31: | Line 32: | ||
* Average score per specialization and translator summary table | * Average score per specialization and translator summary table | ||
| + | You can see examples of the reports in the pictures below: | ||
| − | [[File:Redirect.jpg|40px|link=Reports]] Back to the ''' | + | [[File:1 report 1.png|border|900px]] |
| + | |||
| + | [[File:1 report mi.png|border|800px]] | ||
| + | |||
| + | [[File:Redirect.jpg|40px|link=Reports]] Back to the '''Reports''' page | ||
Latest revision as of 17:10, 9 February 2022
Evaluator report page: cloud.tqauditor.com/report/evaluator
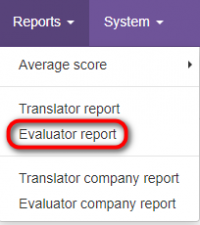
To view the report on a particular evaluator, go to "Reports" → "Evaluator report":
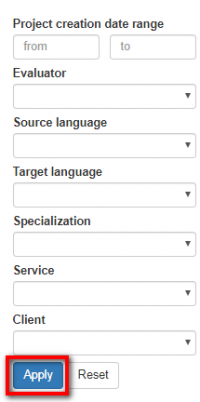
First, you should choose the evaluator.
You can also use the filters:
Click "Apply" to generate the report by specified criteria.
The list of charts and tables in the translator report:
- Score dynamics
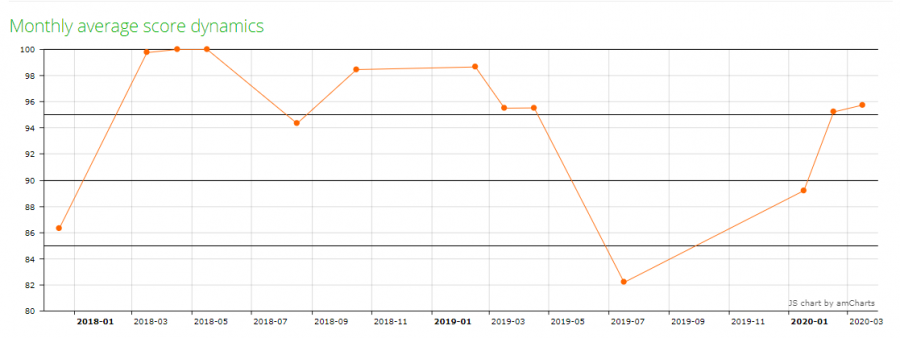
- Monthly average score dynamics
- Managed by
- Translators evaluated
- Projects by specialization
- Mistakes by type
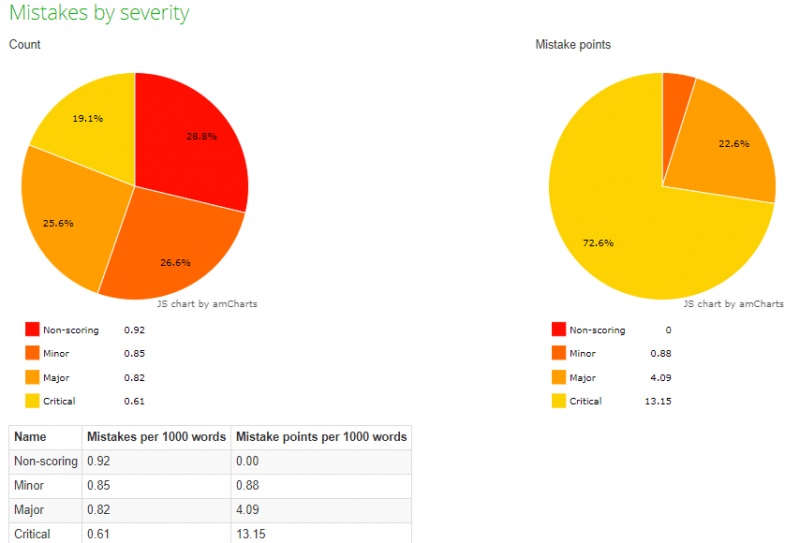
- Mistakes by severity
- Average score per specialization and translator summary table
You can see examples of the reports in the pictures below:


