Difference between revisions of "Average score per translator"
From TQAuditor Wiki
| Line 9: | Line 9: | ||
On this page, you may find the chart and brief tab - the average score per translator. | On this page, you may find the chart and brief tab - the average score per translator. | ||
| + | |||
| + | ::<span style="color:orange">'''[new version]'''</span>The report is displayed as a chart and table: | ||
[[File:Av1.png|border|900px]] | [[File:Av1.png|border|900px]] | ||
Here you can also specify the project creation date range, languages, etc.: | Here you can also specify the project creation date range, languages, etc.: | ||
| + | |||
| + | ::<span style="color:orange">'''[new version]'''</span> You can also use the filters: | ||
[[File:Apdply.png|border|200px]] | [[File:Apdply.png|border|200px]] | ||
[[File:Redirect.jpg|40px|link=Reports]] Back to the '''Reports''' page. | [[File:Redirect.jpg|40px|link=Reports]] Back to the '''Reports''' page. | ||
Revision as of 13:57, 8 February 2022
Average score per translator page: cloud.tqauditor.com/report/translator-average
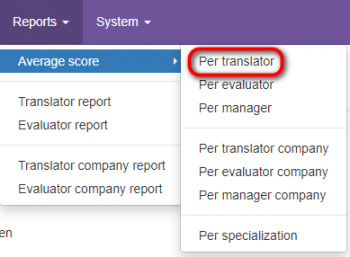
To view the "Average score per translator" report, go to "Reports" → "Average score" → "Per translator":
- [new version] To view the report on the average score per translator, go to "Reports" → "Average score" → "Per translator":
On this page, you may find the chart and brief tab - the average score per translator.
- [new version]The report is displayed as a chart and table:
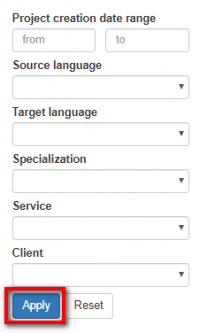
Here you can also specify the project creation date range, languages, etc.:
- [new version] You can also use the filters:


